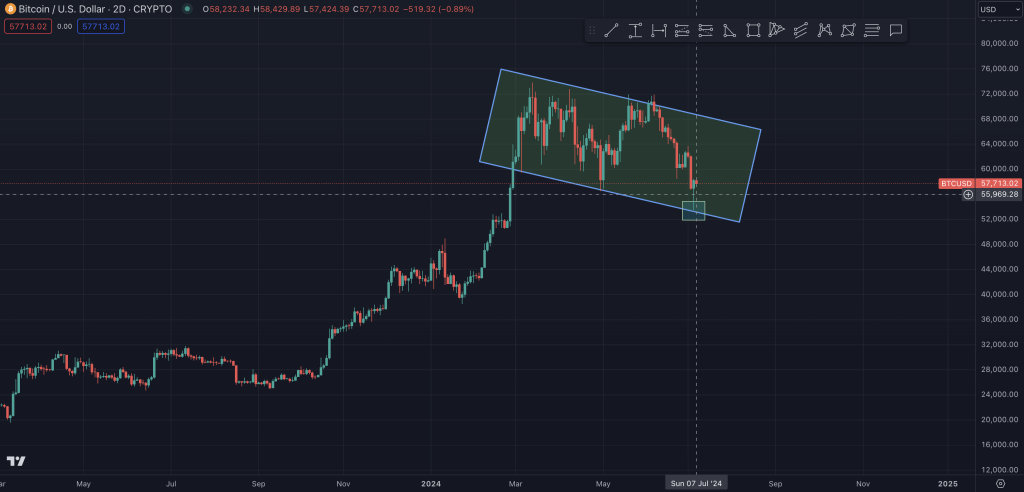
From the past trading experience, I’ve recently identified a classic rising flag pattern in Bitcoin’s price action. This pattern typically signals a continuation of the upward trend. So, after significant recent volatility, will Bitcoin continue to drop? In this post, I’ll analyze this 2D range pattern and its potential market impact from a professional trading analyst’s perspective.
Flag Pattern Analysis

Flagpole
The flagpole of the rising flag pattern is characterized by a rapid and steep upward movement. Around March 2024, Bitcoin’s price surged from approximately $40,256.65 to near $68,000. This rapid rally, accompanied by a significant increase in volume, forms the typical flagpole.
Flag
After hitting the high, Bitcoin entered a brief consolidation phase within an inclined channel, forming the flag portion. Currently, the price fluctuates around $57,720.22, with the channel’s upper and lower boundaries confining the price movement.
Volume Changes
In a classic rising flag pattern, the flagpole’s upward movement is accompanied by an increase in volume, while the flag’s consolidation is marked by a volume decrease. Although volume isn’t directly shown in the chart, market observations confirm this characteristic in Bitcoin’s current price action.
Analysis
Recent Plunge and Rebound
In the past few days, Bitcoin experienced a significant plunge, touching the lower boundary of the rising channel. However, the price quickly rebounded, indicating the effectiveness of this support level. This strong rebound reflects the market’s confidence in the current support level.
Support and Resistance
- Support: The current lower boundary of the rising channel is a critical support area. If the price finds support and rebounds from this area, it could retest the upper boundary.
- Resistance: The upper boundary of the rising channel is the major resistance area. Breaking through this resistance could trigger a new round of rally.
Breakout and Confirmation
For a rising flag pattern to be confirmed, the price must break through the flag’s upper boundary with increased volume. If Bitcoin’s price can surpass the channel’s upper boundary, it signifies pattern confirmation and the potential for a new upward trend.
Risk Control
As a professional trading analyst, I recommend paying attention to the following when making trading decisions:
- Breakout Confirmation: Only confirm a new upward trend if the price breaks through the upper boundary with increased volume.
- Stop-Loss Setting: To control risk, set a stop-loss if the price falls below the channel’s lower boundary to avoid potential further declines.
Conclusion and Outlook
Bitcoin’s current rising flag pattern suggests the market may continue to rise after consolidation. Traders should closely watch the price action at the channel’s boundaries, especially a breakout above the upper boundary. If confirmed, the market could continue to rise and challenge new highs.
As a professional trading analyst, I recommend maintaining a cautiously optimistic attitude in the current market, setting reasonable stop-loss and take-profit levels to ensure a steady trading strategy amid market fluctuations.
Chart Display
The chart below shows the current rising flag pattern in Bitcoin’s price:

The chart clearly shows the price fluctuating within the rising channel, with the future direction depending on whether the price can effectively break through the channel’s upper boundary.
Disclaimer
The content of this post is for informational purposes only and does not constitute investment advice. Before making any investment decisions, consider your circumstances and consult a professional investment advisor.
